Blogger Stats provides you a very useful analytics about your blog. You can extract lot of valuable information from its analytics that helps you to improve the performance of your blog and its pages on the SERPs (Search Engine Results Pages).
On Blogger Stats you can get detailed information about your blog followers, audience, page views, top performing posts, top referrers, top referrering URLs, audience, search keywords, & top locations.
RELATED
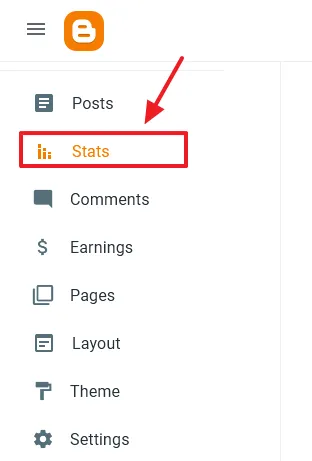
Go to your Blogger Dashboard & click the Stats from the Sidebar.
- At top of the page you can check your blog Followers, Number of posts, and Total number of comments posted on your blog.
- All Time shows the lifetime views of your blog, means the total views from the day you created your blog to till date.
- Today shows the views of current date.
- Yesterday shows the total views of yesterday so that you can compare your today’s traffic with yesterday’s.
- This Month shows the views of current month till date.
- Last Month shows the total views of last month so that you can compare your current month’s traffic with the last month’s traffic.

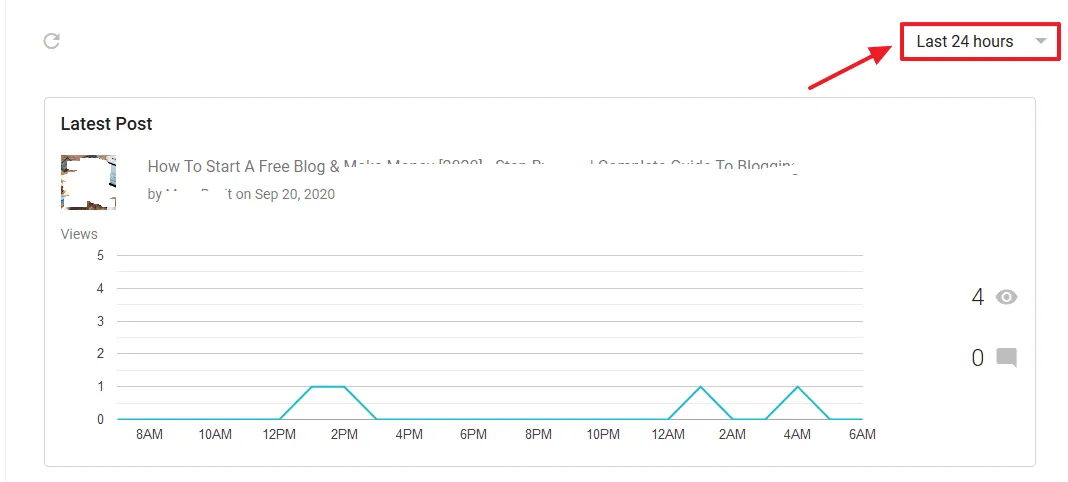
- Latest Post section shows the performance of your latest post by a graph + number of views & number of comments.
- The Graph tells you that at what time the “Latest Post” got how many views. You can see that in last 24 hrs in between 12PM to 4PM it has got a 1 view. There are no views till 12AM. In between 12AM to 2AM it has got 1 view.
- A stable graph shows that a post is performing well, and an unstable graph shows that a post is not performing well.
- Below are the stats of “last 24 hours” for this post. You can change the time from the Time Filter as I have highlighted. Always remember that the Time Filter is applied to all the stats of the blog.
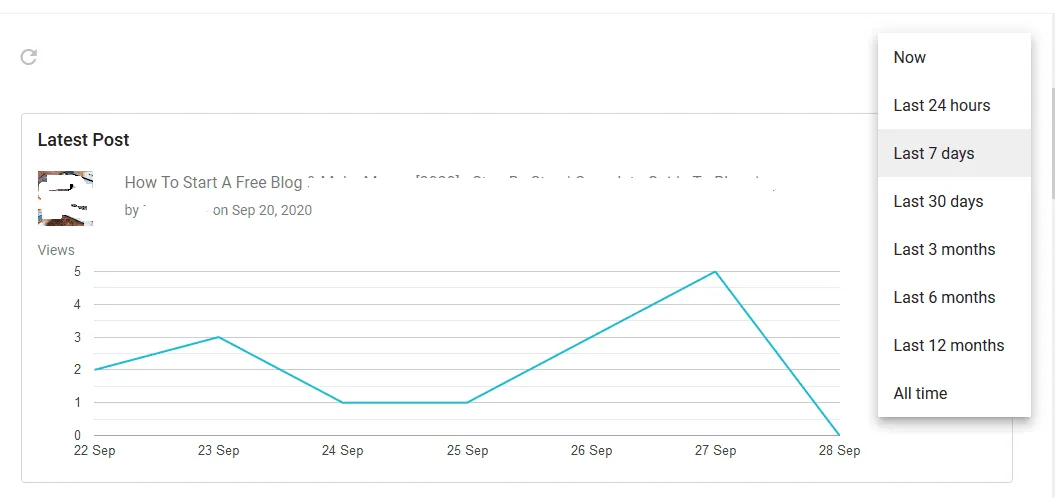
- Now below you can see that I have chosen “Last 7 Days” from the Time Filter. The graph is showing you the number of views in specific days of last 7 days.
- The graph is also showing you that this post has performed better in last 7 days as compared to last 24 hours.
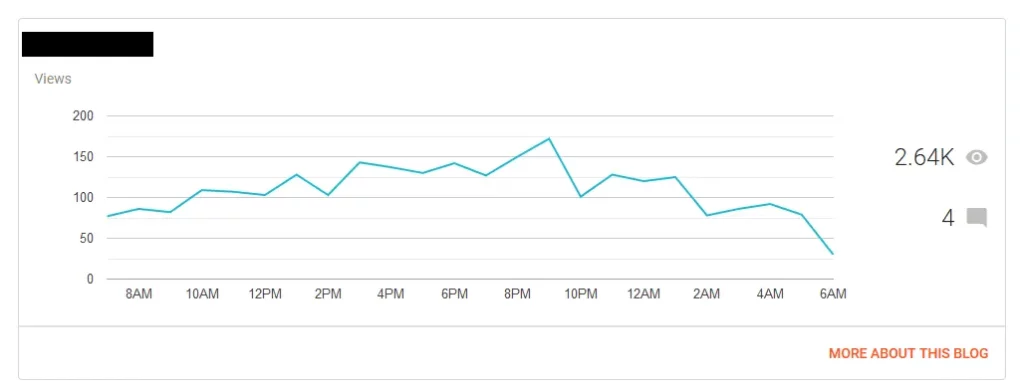
- After the “Latest Post” section there is a graph for showing the performance of your whole blog including posts and pages based on Time Filter that you choose.
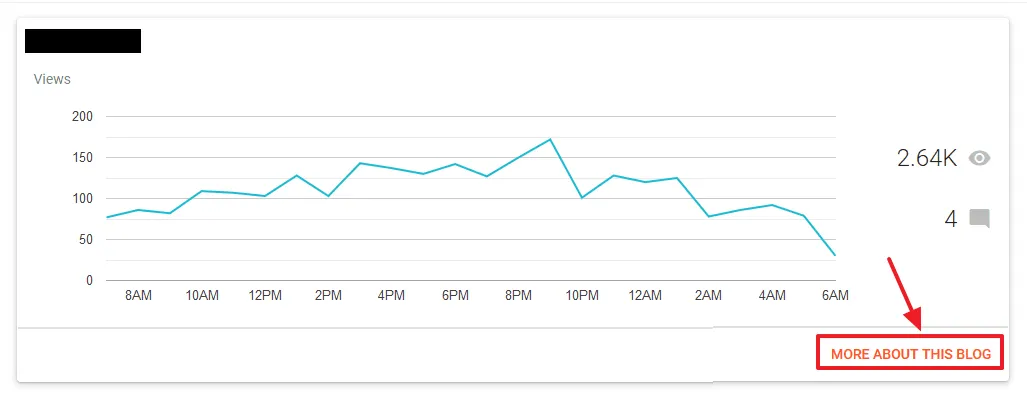
- Below is the overall performance of a blog in last 24 hours. It tells you that in last 24 hours from 8PM to10PM it has got most number of views i.e. 150. This graph helps you to know at what time your blog gets maximum traffic and at what time it gets minimum traffic.
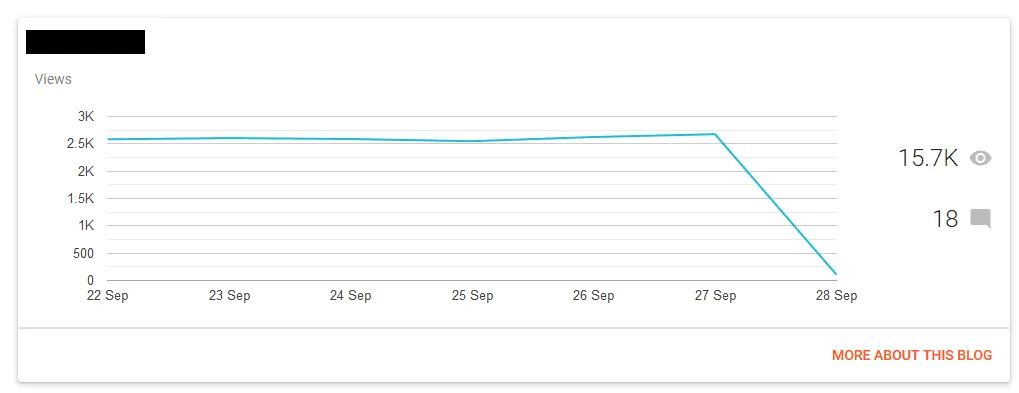
- Here, I have chosen the Time Filter “Last 7 Days“. It shows the number of views in specific days of last seven days.
- The graph is very stable and this blog is consistently getting 2.5K views regularly.
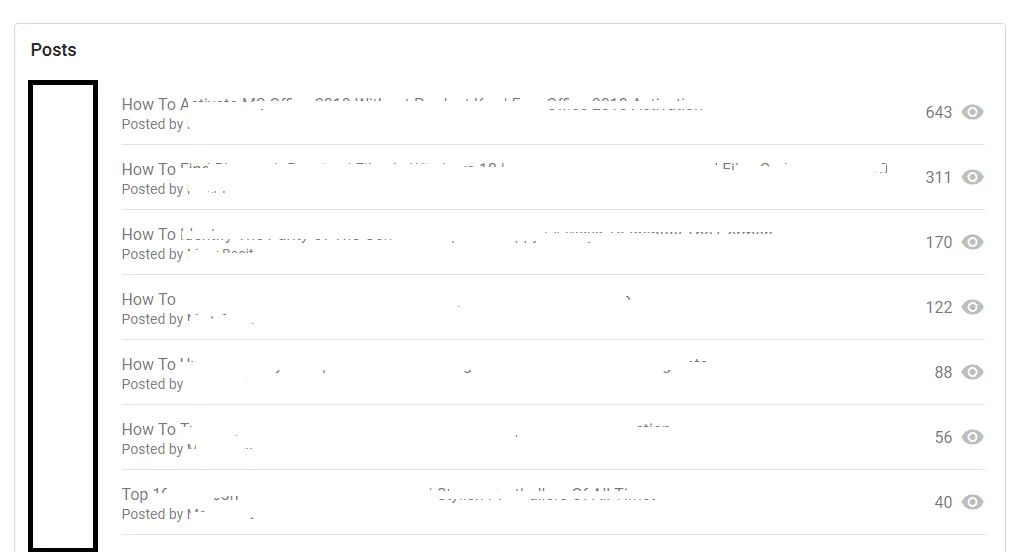
- Posts section shows the top performing posts of your blog based on your chosen Time Filter. Here it is showing the top posts of a blog in last 24 hours.
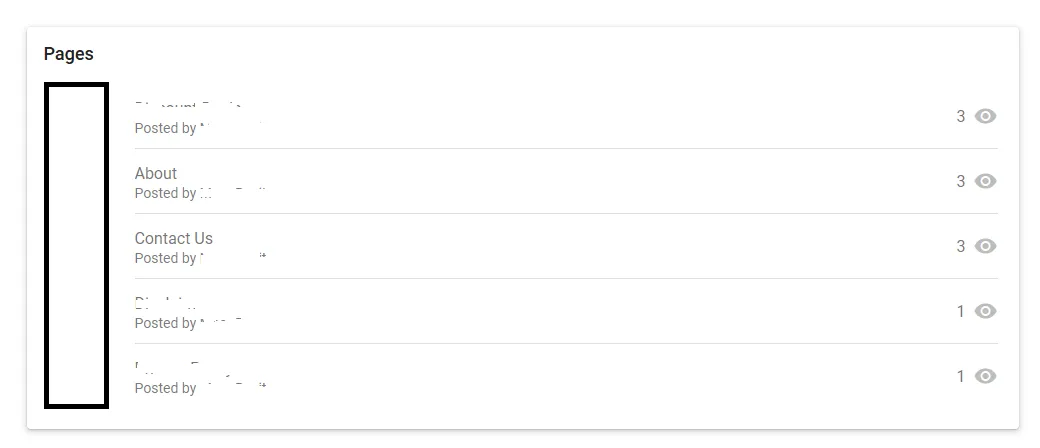
- Pages section shows the number of page views of blog pages based on your chosen Time Filter. Remember that, on Blogger, Pages are different from the Posts.
- Below, it is showing you the page views of a blog in last 24 hours.
- Now scroll up and click the “MORE ABOUT THIS BLOG” link, located below the “Latest Post” section.
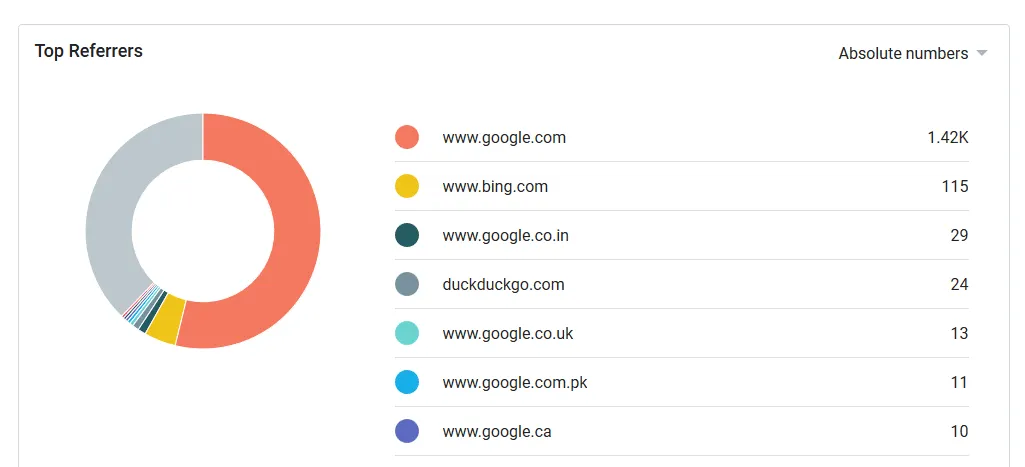
- Top Referrers section shows the list of top sites from where visitors came to your blog via your blog link or your any post link based on your chosen Time Filter. In other words “Referrer” is a webpage that sends visitors to your site using a link. A referrer can be a blog, website, forum, or search engines (Google, Bing, Yahoo, etc).
- For example, a visitor searches “How to create a Blogger blog” on Google. In the search results Google lists a relevant post of Meer’s World. Now visitor clicks that link and opens that post. Here the Referrer is “Google” because that visitor came from Google to Meer’s World.
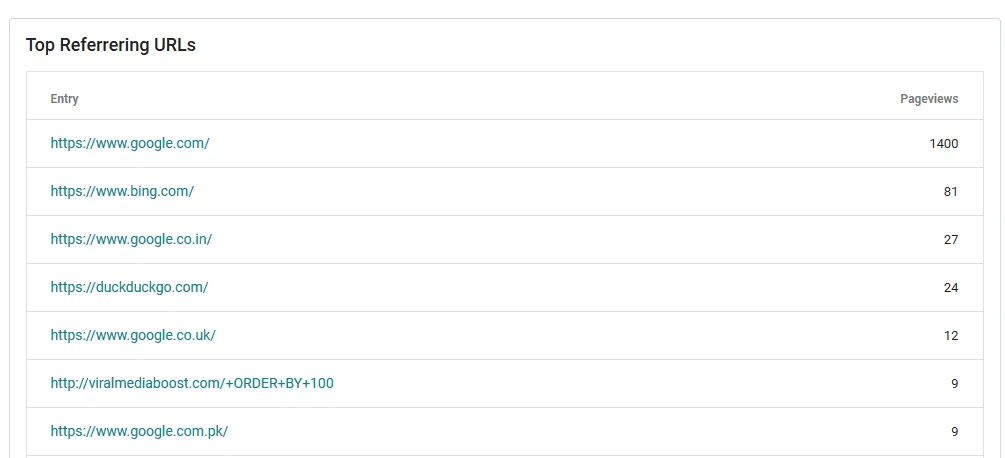
- Top Referrering URLs section shows those URLs from which unique visitors visit your blog or website.
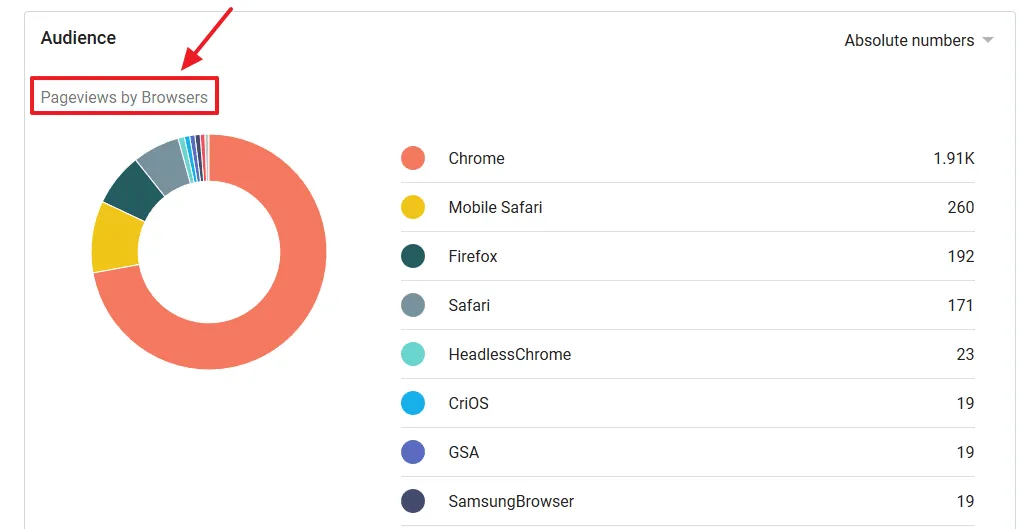
Audience section shows information about the browsers and operating systems through which visitors visited your blog.
- Pageviews by Browsers shows the browsers on which your visitors browse your blog.
- Below you can see that in last 24 hours most number of people browse this blog from Google Chrome.
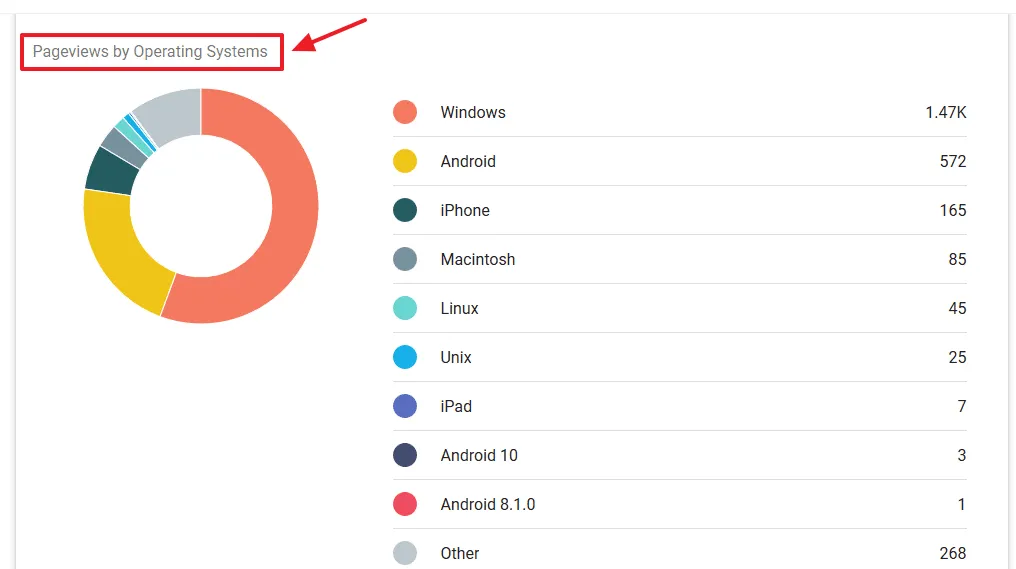
- Pageviews by Operating Systems shows the operating systems (Windows, Android, iPhone, Linux, Macintosh, etc) on which your visitors visited your blog.
- Below you can see that the most number of blog visitors used Microsoft Windows operating system in the last 24 hours.
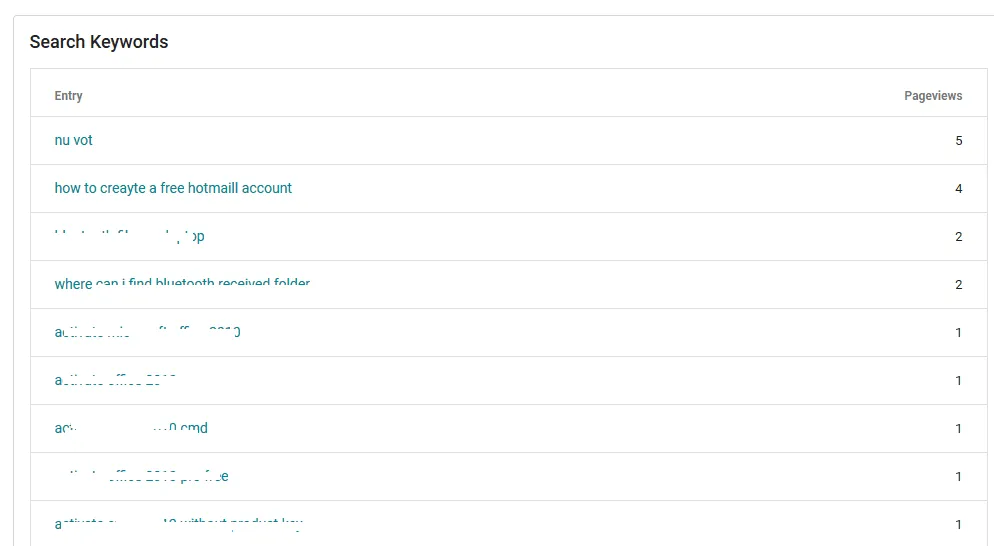
- Search Keywords section shows the list of keywords through which people found your blog or blog posts on Google search results. These are the keywords on which your blog/posts are getting ranked on the Google search results.
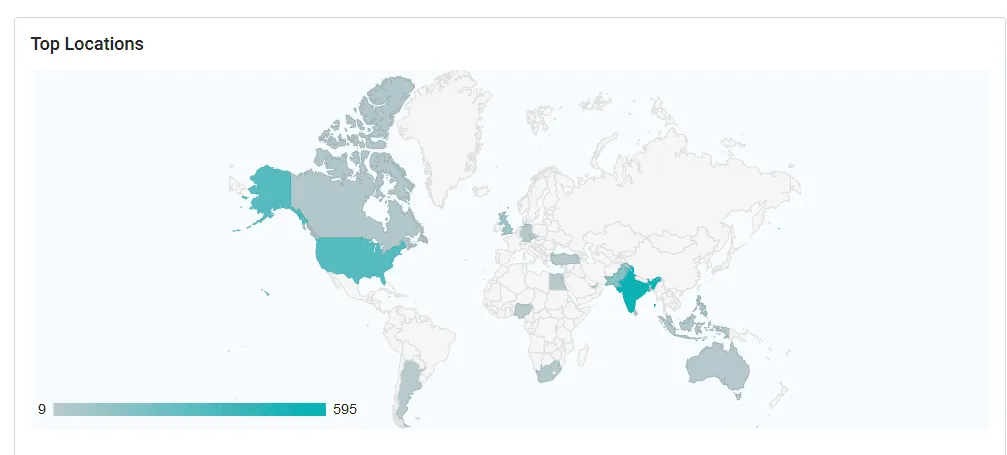
- Top Locations section shows the countries from which most number of people visited your blog.
- On the map, locations highlighted with the darker color indicates that these are the top locations.
- Move the mouse pointer over a specific location on map, it will show you the number of views with country code.
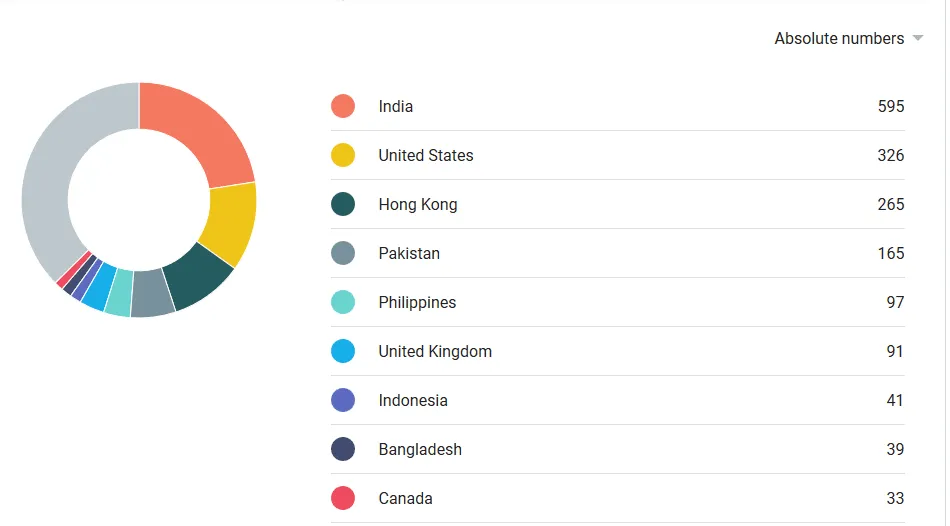
- Below you can see the top locations with number of visits from each country in a list view.
- In order to explore the complete analytics of your blog, link your blog to Google Analytics. If you haven’t created a Google Analytics account yet, read this tutorial: How to Link Blogger to Google Analytics 4 | Measurement ID.
- Click the link “MORE ON GOOGLE ANALYTICS” at bottom of the Stats page or click here.

I hope that you must have a good understanding of Blogger Stats. If you like this post then don’t forget to share with people. Share your feedback in the comments section below.


Leave a Reply